This study examines the impact of renewable energy consumption and electricity tariff on the economy of Nigeria. The study considers the casual relationship and vector decomposition between various renewable energy sources (solar, hydro and biomass), electricity price and Gross domestic product (GDP) using an unrestricted vector error correction model (VECM). In addition, other robust econometric techniques were applied to the time series of GDP, electricity price and energy consumption from renewable energy sources from 1980 to 2021. The findings indicated a 1% increase in biomass consumption causes increase in GDP by 0.14% in the long-run. Mixed result in the short-run with the difference in the log value of the current lag of solar and bio electricity consumption having positive impact on GDP. The coefficient of the Error Correction Model (ECM) was negative (-0.49) and statistically significant indicating that short-run change from the long-run equilibrium is corrected by 49% annually. Unidirectional causality from GDP to solar electricity consumption. Solar, hydro, biomass and electricity price explain 1.4%, 0.4% 2.2% & 12% respectively of fluctuations in GDP in the long-run. The study results demonstrates that regulations need to be put in place to control the adverse effect of consuming biomass on the environment which could cause mixed impact on gross domestic product in the short run whereas, policies to foster development of solar projects could impact positively on GDP and alleviate the electricity supply deficiency in Nigeria.
| Published in | Journal of Energy and Natural Resources (Volume 13, Issue 4) |
| DOI | 10.11648/j.jenr.20241304.11 |
| Page(s) | 138-151 |
| Creative Commons |
This is an Open Access article, distributed under the terms of the Creative Commons Attribution 4.0 International License (http://creativecommons.org/licenses/by/4.0/), which permits unrestricted use, distribution and reproduction in any medium or format, provided the original work is properly cited. |
| Copyright |
Copyright © The Author(s), 2024. Published by Science Publishing Group |
Economic Growth, Renewable Energy, Electricity Consumption, Electricity Price, GDP, Econometrics
 Solar,Hydro,Biomass,ElectricityPrice,Ɛ)(1)
  (4)
(4)Gross Domestic Product GDP [BUSD] | Electricity Consumption from Solar [billion kWh] | Electricity Consumption from Hydro [billion kWh | Electricity Consumption from Biomass [billion kWh | Electricity Price [#/kWh] | |
|---|---|---|---|---|---|
Mean | 201.3 | 0.0 | 5.5 | 0.0 | 11.4 |
Std. Dev. | 174.6 | 0.0 | 1.8 | 0.0 | 14.5 |
Maximum | 574.2 | 0.0 | 8.4 | 0.0 | 45.6 |
Minimum | 27.8 | 0.0 | 1.9 | 0.0 | 0.8 |
Skewness | 0.7 | 1.6 | -0.3 | 0.2 | 1.4 |
Kurtosis | 1.9 | 4.0 | 2.3 | 1.5 | 3.4 |
Jarque-Bera | 5.4* | 18.9*** | 1.4 | 4.5 | 13.0*** |
Observations | 42 | 42 | 42 | 42 | 42 |
Positive Skewness and Platykurtic | Positive Skewness and Leptokurtic | Negative Skewness and Platykurtic | Positive Skewness and Platykurtic | Positive Skewness and Leptokurtic |
Variable | Level | None | First Difference | None | I(n) | ||
|---|---|---|---|---|---|---|---|
Constant | Constant & Trend | Constant | Constant & Trend | ||||
LGDP | -0.3201 | -2.8348 | 0.3400 | -4.9999*** | .-5.1828*** | -4.9876*** | I(1) |
LSOL_EC | -0.2753 | -1.8676 | -1.2461 | -6.3847*** | -6.4662*** | -6.2224*** | I(1) |
LHYDRO_EC | -1.5899 | -2.1237 | 0.7274 | -7.7392*** | -7.7555*** | -7.4603*** | I(1) |
LBIO_EC | -0.9855 | -1.9971 | -1.4158 | -6.3377*** | -6.2545*** | -6.2444*** | I(1) |
LEPRICE | 0.3056 | -2.3985 | 2.4474 | -5.7772*** | -5.7907*** | -4.8848*** | I(1) |
Levels Equation | Case 3: Unrestricted Constant and No Trend | |||
|---|---|---|---|---|
Variable | Coefficient | Std. Error | t-Statistic | Prob. |
LSOLAR | 0.014089 | 0.025978 | 0.542326 | 0.593 |
LHYDRO | -0.49154 | 0.462016 | -1.063902 | 0.2989 |
LBIO | 0.14097 | 0.019452 | 7.247055 | 0 |
LEPRICE | 0.157449 | 0.226904 | 0.693904 | 0.495 |
EC = LGDP - (0.0141*LSOLAR - 0.4915*LHYDRO + 0.1410*LBIO + 0.1574*LEPRICE) | ||||
F-Bounds Test | Null Hypothesis: No levels relationship | |||
Test Statistic | Value | Signif. | I(0) | I(1) |
F-statistic | 4.228297 | 10% | 2.45 | 3.52 |
k | 4 | 5.00% | 2.86 | 4.01 |
3% | 3.25 | 4.49 | ||
1% | 3.74 | 5.06 | ||
Actual Sample Size | 38 | Finite Sample: n=40 | ||
ECM Regression | Case 3: Unrestricted Constant and No Trend | ||
|---|---|---|---|
Variable | Coefficient | Std. Error | t-Statistic |
C | 3.491499*** | 0.694627 | 5.026435 |
D(LSOLAR) | 0.02439* | 0.011995 | 2.03336 |
D(LHYDRO) | -0.152859 | 0.162281 | -0.941935 |
D(LHYDRO(-1)) | -0.034636 | 0.159178 | -0.217592 |
D(LHYDRO(-2)) | -0.529463*** | 0.150256 | -3.523747 |
D(LBIO) | 0.023914** | 0.011014 | 2.171276 |
D(LBIO(-1)) | -0.051848*** | 0.015172 | -3.417374 |
D(LBIO(-2)) | -0.032723* | 0.015872 | -2.061677 |
D(LBIO(-3)) | -0.029437** | 0.01364 | -2.158108 |
D(LEPRICE) | -0.03766 | 0.113367 | -0.332196 |
D(LEPRICE(-1)) | 0.187812 | 0.110005 | 1.707303 |
CointEq(-1)* | -0.491158*** | 0.09826 | -4.998539 |
R-squared | 0.678572 | Mean dependent var | 0.039815 |
Adjusted R-squared | 0.542583 | S. D. dependent var | 0.181339 |
S. E. of regression | 0.122644 | Akaike info criterion | -1.106971 |
Sum squared resid | 0.391081 | Schwarz criterion | -0.589839 |
Log likelihood | 33.03245 | Hannan-Quinn criter. | -0.922979 |
F-statistic | 4.989912 | Durbin-Watson stat | 1.999192 |
Prob(F-statistic) | 0.000367 | ||
Test | Test Type | F-Stat |
|---|---|---|
Linearity | Ramsey RESET | 1.575383 |
Heteroskedasticity | ARCH [2] | 0.389045 |
Serial Correlation | Breusch-Godfrey | 0.043428 |
Normality | Jarque-Bera | 31.3043*** |
Null Hypothesis (H0): | F-Stat | Prob. | Decision | Causality |
|---|---|---|---|---|
LSOLAR does not Granger Cause LGDP | 0.01993 | 0.8885 | Accept | |
LGDP does not Granger Cause LSOLAR | 5.95432 | 0.0195 | Reject | Unidirectional |
LHYDRO does not Granger Cause LGDP | 2.65005 | 0.1118 | Accept | |
LGDP does not Granger Cause LHYDRO | 0.00058 | 0.981 | Accept | |
LBIO does not Granger Cause LGDP | 7.24029 | 0.0105 | Reject | Unidirectional |
LGDP does not Granger Cause LBIO | 0.00566 | 0.9404 | Accept | |
LEPRICE does not Granger Cause LGDP | 1.84911 | 0.1819 | Accept | |
LGDP does not Granger Cause LEPRICE | 0.27673 | 0.6019 | Accept | |
LHYDRO does not Granger Cause LSOLAR | 0.37703 | 0.5429 | Accept | |
LSOLAR does not Granger Cause LHYDRO | 1.01554 | 0.32 | Accept | |
LBIO does not Granger Cause LSOLAR | 3.46137 | 0.0706 | Reject | Unidirectional |
LSOLAR does not Granger Cause LBIO | 0.00315 | 0.9556 | Accept | |
LEPRICE does not Granger Cause LSOLAR | 7.67155 | 0.0086 | Reject | Unidirectional |
LSOLAR does not Granger Cause LEPRICE | 0.21753 | 0.6436 | Accept | |
LBIO does not Granger Cause LHYDRO | 0.61789 | 0.4367 | Accept | |
LHYDRO does not Granger Cause LBIO | 2.03855 | 0.1615 | Accept | |
LEPRICE does not Granger Cause LHYDRO | 1.06728 | 0.3081 | Accept | |
LHYDRO does not Granger Cause LEPRICE | 2.26312 | 0.1408 | Accept | |
LEPRICE does not Granger Cause LBIO | 0.5059 | 0.4813 | Accept | |
LBIO does not Granger Cause LEPRICE | 3.98185 | 0.0532 | Reject | Unidirectional |
Variable | Long Run Impact | Short Run Impact |
|---|---|---|
GDP | GDP | |
Growing Economy | Increase | Increase |
LSOL_EC | Not significant** | Increase** |
LHYDRO_EC | Not significant | Decrease |
LBIO_EC | Increase* | Mixed* |
LEPRICE | Not significant | Not significant |
ARDL | Auto Regressive Distributed Lag |
GDP | Gross Domestic Product |
CRW | Combustible Renewable Waste |
ADF | Augmented Dickey Fuller |
VECM | Vector Error Correction Model |
EIA | Energy Information Administration |
LSOL_EC | Log of Solar Electricity Consumption |
LHYDRO_EC | Log of Hydro Electricity Consumption |
LBIO_EC | Log of Biomass Consumption |
LEPRICE | Log of Electricity Proce |
DOLS | Dynamic Ordinary Least Squares |
OLS | Ordinary Least Squares |
ECM | Error Correction Moded |
VAR | Vector Auto Regressive |
| [1] | Fotourehchi, Z. Renewable Energy Consumption and Economic Growth: A Case Study for Developing Countries. International Journal of Energy, Economics and Policy. 2017, 7(2), 61-64. |
| [2] |
IEA. World Energy Outlook. Paris, France: International Energy Agency. 2009, Retrieved from
http://www.worldenergyoutlook.org/media/ (accessed 6 October 2023). |
| [3] | Ebube, O. F., Akan, E. E. The Other Side: Negative Impacts of Exploiting Renewable Energy Sources. European Journal of Engineering and Technology Research. 2021, 6(3), 30–33. |
| [4] | Shahid. A, Zhang, J., Azeem, A., Mahmood, A. Impact of electricity consumption on economic growth: an application of vector error correction model and artificial neural networks. The Journal of Developing Areas. 2020, 54(4). |
| [5] | Jacobo, C., Viviana S. The relationship between energy consumption and GDP: evidence from a panel of 10 Latin American countries." Latin American Journal of Economics. 2013, 50(2), pp. 23. |
| [6] | Westerlund, J. Testing for panel cointegration with multiple structural breaks. Oxford Bulletin of Economics and Statistics. 2006, 68: 10132. |
| [7] | Kammen, D. M., Pless, J.. Beyond Technology: Demand-Side Solutions for Climate Change Mitigation. Annual Review of Environment and Resources. 2007, 32, 271-293. |
| [8] | Kaldellis, J. K., Kapsali, M. Optimum Sizing of Small Photovoltaic-Based Hybrid Power Stations for Various Greek Load Profiles. Applied Energy. 2013, 101, 103-118. |
| [9] | Fthenakis, V., et al. Technical and Economic Feasibility of Central-Station Photovoltaic Power Plants for Application in the Sundrenched Desert Regions. Progress in Photovoltaics: Research and Applications. 2009, 17(2), 125-135. |
| [10] |
IEA. Global Energy Review 2019, IEA, Paris. Available from
https://www.iea.org/reports/global-energy-review-2019 (accessed 6 December 2022). |
| [11] | Karekezi, S., Kithyoma, W. Renewable Energy Strategies for Rural Africa: Is a PV-led Renewable Energy Strategy the Right Approach for Providing Modern Energy to the Rural Poor of Sub-Saharan Africa? Energy Policy. 2002 30(11-12), 1071-1086. |
| [12] | Asafu-Adjaye, J. The relationship between energy consumption, energy prices, and economic growth: Time series evidence from Asian developing countries. Energy Economics. 2000, 22(6), 615-625. |
| [13] | Lee, C. C., Chang, C. P. Energy consumption and GDP revisited: A panel analysis of developed and developing countries. Energy Economics. 2008, 30(6), 2349-2359. |
| [14] | Wolde-Rufael, Y. Electricity consumption and economic growth: A time series experience for 17 African countries. Energy Policy. 2006, 34(10), 1106-1114. |
| [15] | Apergis, N., Payne, J. E. Renewable energy consumption and economic growth: Evidence from a panel of OECD countries. Energy Policy. 2010, 38(1), 656-660. |
| [16] | Nwosa, P., Akinbobola, T. Aggregate Energy Consumption and Sectoral Output in Nigeria. African Research Review. 2012, 6(4) pp 206-215. |
| [17] | Chitedze, I., Nwedeh, C. C., Adeola, A., Abonyi, D. C. An econometric analysis of electricity consumption and real sector performance in Nigeria. International Journal of Energy Sector Management. 2021, 15(4), pp 855-873. |
| [18] | Apergis, N., Payne, J. E. The renewable energy consumption–growth nexus in Central America. Applied Energy. 2011, 88(1), 343-347. |
| [19] | Narayan P. K., Popp S. The energy consumption-real GDP nexus revisited: Empirical evidence from 93 countries. Economic Modelling. 2012, 29, pp 303-308. |
| [20] | Marinaș M. C., Dinu M., Socol A. G., Socol C. Renewable energy consumption and economic growth. Causality relationship in Central and Eastern European countries. 2018, 13(10): e0202951. |
| [21] | Maji, I., Sulaiman C., Rahim A. Renewable energy consumption and economic growth nexus: A fresh evidence from West Africa. Energy Reports. 2019, 5 |
| [22] | Jebli, B. M., Ben Y. S. Economic growth, combustible renewables and waste consumption, and CO2 emissions in North Africa. Environmental Science and Pollution Research. 2022, 22, 16022–16030. |
| [23] | Amri, F. Intercourse across economic growth, trade, and renewable energy consumption in developing and developed countries. Renewable and Sustainable Energy Reviews. 2017, 69, pp. 527- 534. |
| [24] | Abdalla, A. N., Jing, W., Nazir, M. S., Jiang, M., Tao, H. Socio-economic impacts of solar energy technologies for sustainable green energy: a review. Cleaner Engineering and Technology. 2023, 25, 13695-137325. |
| [25] | Rafal K. Electricity consumption and economic growth: Evidence from Poland. Journal of International Studies. 2014, 7(1). |
| [26] | Ohler, A., Fetters, I. The causal relationship between renewable electricity generation and GDP growth: A study of energy sources. Energy Economics. 2014, 43 pp, 125-139. |
APA Style
Orisa, E., Ibe, A., Nteegah, A. (2024). Impact of Energy Consumption from Renewable Energy Sources on Economic Growth: Evidence from Nigeria. Journal of Energy and Natural Resources, 13(4), 138-151. https://doi.org/10.11648/j.jenr.20241304.11
ACS Style
Orisa, E.; Ibe, A.; Nteegah, A. Impact of Energy Consumption from Renewable Energy Sources on Economic Growth: Evidence from Nigeria. J. Energy Nat. Resour. 2024, 13(4), 138-151. doi: 10.11648/j.jenr.20241304.11
AMA Style
Orisa E, Ibe A, Nteegah A. Impact of Energy Consumption from Renewable Energy Sources on Economic Growth: Evidence from Nigeria. J Energy Nat Resour. 2024;13(4):138-151. doi: 10.11648/j.jenr.20241304.11
@article{10.11648/j.jenr.20241304.11,
  author = {Ebube Orisa and Anthony Ibe and Alwell Nteegah},
  title = {Impact of Energy Consumption from Renewable Energy Sources on Economic Growth: Evidence from Nigeria
},
  journal = {Journal of Energy and Natural Resources},
  volume = {13},
  number = {4},
  pages = {138-151},
  doi = {10.11648/j.jenr.20241304.11},
  url = {https://doi.org/10.11648/j.jenr.20241304.11},
  eprint = {https://article.sciencepublishinggroup.com/pdf/10.11648.j.jenr.20241304.11},
  abstract = {This study examines the impact of renewable energy consumption and electricity tariff on the economy of Nigeria. The study considers the casual relationship and vector decomposition between various renewable energy sources (solar, hydro and biomass), electricity price and Gross domestic product (GDP) using an unrestricted vector error correction model (VECM). In addition, other robust econometric techniques were applied to the time series of GDP, electricity price and energy consumption from renewable energy sources from 1980 to 2021. The findings indicated a 1% increase in biomass consumption causes increase in GDP by 0.14% in the long-run. Mixed result in the short-run with the difference in the log value of the current lag of solar and bio electricity consumption having positive impact on GDP. The coefficient of the Error Correction Model (ECM) was negative (-0.49) and statistically significant indicating that short-run change from the long-run equilibrium is corrected by 49% annually. Unidirectional causality from GDP to solar electricity consumption. Solar, hydro, biomass and electricity price explain 1.4%, 0.4% 2.2% & 12% respectively of fluctuations in GDP in the long-run. The study results demonstrates that regulations need to be put in place to control the adverse effect of consuming biomass on the environment which could cause mixed impact on gross domestic product in the short run whereas, policies to foster development of solar projects could impact positively on GDP and alleviate the electricity supply deficiency in Nigeria.},
 year = {2024}
}
TY  - JOUR
T1  - Impact of Energy Consumption from Renewable Energy Sources on Economic Growth: Evidence from Nigeria

AU  - Ebube Orisa
AU  - Anthony Ibe
AU  - Alwell Nteegah
Y1  - 2024/10/29
PY  - 2024
N1  - https://doi.org/10.11648/j.jenr.20241304.11
DO  - 10.11648/j.jenr.20241304.11
T2  - Journal of Energy and Natural Resources
JF  - Journal of Energy and Natural Resources
JO  - Journal of Energy and Natural Resources
SP  - 138
EP  - 151
PB  - Science Publishing Group
SN  - 2330-7404
UR  - https://doi.org/10.11648/j.jenr.20241304.11
AB  - This study examines the impact of renewable energy consumption and electricity tariff on the economy of Nigeria. The study considers the casual relationship and vector decomposition between various renewable energy sources (solar, hydro and biomass), electricity price and Gross domestic product (GDP) using an unrestricted vector error correction model (VECM). In addition, other robust econometric techniques were applied to the time series of GDP, electricity price and energy consumption from renewable energy sources from 1980 to 2021. The findings indicated a 1% increase in biomass consumption causes increase in GDP by 0.14% in the long-run. Mixed result in the short-run with the difference in the log value of the current lag of solar and bio electricity consumption having positive impact on GDP. The coefficient of the Error Correction Model (ECM) was negative (-0.49) and statistically significant indicating that short-run change from the long-run equilibrium is corrected by 49% annually. Unidirectional causality from GDP to solar electricity consumption. Solar, hydro, biomass and electricity price explain 1.4%, 0.4% 2.2% & 12% respectively of fluctuations in GDP in the long-run. The study results demonstrates that regulations need to be put in place to control the adverse effect of consuming biomass on the environment which could cause mixed impact on gross domestic product in the short run whereas, policies to foster development of solar projects could impact positively on GDP and alleviate the electricity supply deficiency in Nigeria.
VL  - 13
IS  - 4
ER  -
Emerald Energy Institute, University of Port Harcourt, Choba, Nigeria
Biography: Ebube Orisa is a Ph. D. scholar of Energy Economics at the Emerald Energy Institute. He completed his First Degree in Petroleum Engineering from the Rivers State University, and he holds a Master’s in petroleum engineering and project Development from the Institute of Petroleum and Energy Studies (IPES), IFP/Uniport. He has participated in multiple international research collaboration projects in areas of Petroleum Engineering and Energy Economics. He is a member of Nigerian Society of Engineers (NSE) and the Society of Petroleum Engineers (SPE) where he volunteers for the Port Harcourt section. His research interest is in Reservoir engineering, Energy and Petroleum Economics, Renewable Technologies, Production and Operation Monitoring Optimization.
Research Fields: Reservoir Engineering, Energy Economics, Petroleum Economics, Renewable Energy, Production Optimization, Petroleum Engineering

Department of Electrical/Electronic Engineering, University of Port Harcourt, Choba, Nigeria
Biography: Anthony Ibe holds a B. Eng, 1st Class honours (1979) from University of Nigeria, Nsukka and a PhD, DIC (1984) from Imperial College of Science and Technology, London. Prof. Ibe is a member of Nigerian Society of Engineers (NSE) and a Senior Member, Institute of Electrical and Electronic Engineers (IEEE). He is also a COREN registered Engineer. He has published over 40 articles and four books in Electrical Engineering. He has supervised over 50 masters’ degree students and PhD students. Prof. Ibe is an external examiner and assessor to a couple of Universities within and outside Nigeria.
Research Fields: Energy Economics, Petroleum Economics, Renewable Energy, Power Systems, Electrical Electronics Engineering

Department of Economics, University of Port Harcourt, Choba, Nigeria
Biography: Alwell Nteegah is a Senior Lecturer in the Department of Economics at the University of Port Harcourt., Nigeria. He holds a Master’s and PhD degree in Economics. He has published over 50 articles in Economics. He has supervised over 50 masters’ degree students and PhD students.
Research Fields: Energy Economics, Petroleum Economics, Renewable Energy, Econometrics, Macro and Microeconomics, Banking and Finance

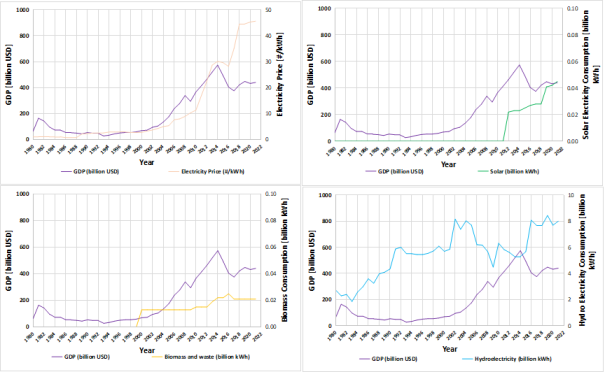
Figure 1.
Plot of GDP with electricity price, solar, hydro and biomass electricity consumption.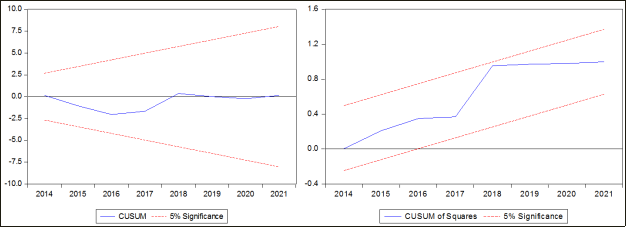
Figure 2. CUSUM Test and CUSUM of Squares Test for GDP.
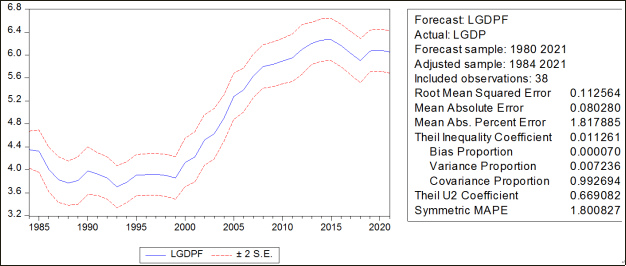
Figure 3. Model forecast performance for GDP.
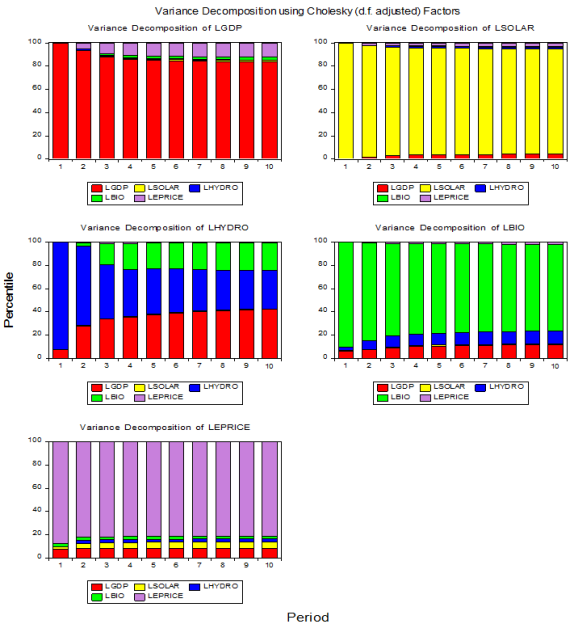
Figure 4. Variance Decomposition of GDP, Electricity Consumption from renewable sources and electricity price.
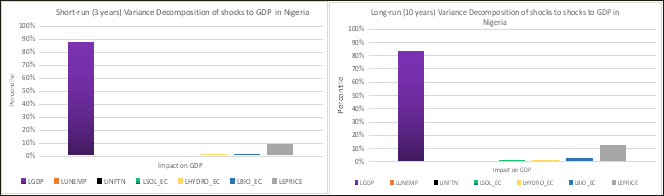
Figure 5. Short run and Long run Variance Decomposition of GDP, Electricity Consumption from Renewable sources and Electricity price.